
Query Plans In The Race Of Extended Events
In the previous articles we took a look at some simple ways to hunt for those valuable query plans and then at how we can accomplish the same using SQL Trace. There is yet another way of discovering and extracting query plans from an in-use SQL Server and that is to use Extended Events.
Before Anything
As you can read on MSDN, the Extended Events system was introduced in SQL Server 2008 with the intention of providing a lightweight yet scalable and configurable system for performance troubleshooting. It was designed to allow a user to grab as much or as little data as needed for a given troubleshooting task, topping that up with a sleek buffering system, intended to greatly improve data gathering performance over that of SQL Trace.
However, keep in mind that Extended Events is not a silver bullet. One thing is a system that requests data in an organized yet lightweight fashion. Another thing is the work of gathering that data itself. Extended Events fulfils the former role in an efficient way. However, the work involved in gathering particular sets of data is going to have some impact, regardless of how you request it, be it with home-made queries, SQL Trace or Extended Events.
This includes all events that request query plans.
We must therefore look at the header picture in this article and always remember:
Even a 268 mph faring Bugatti Veyron will be overtaken by dying snails with a hangover once you mount a 16 ton anvil on it.
- Me, who else?
Right mate… If you say so… Can we start now?
Yes, we can, as that American president says.
Unlike SQL Trace, which requires us to write awkward T-SQL or use a separate application such as SQL Profiler, Extended Events finds full graphical support inside the comfort of SSMS. We can create and manage event capture sessions and view live event quasi-streaming right from inside SSMS.
Let’s take a look at the steps involved in this.
New Session
The first thing we need to do is to create a new Event Capturing Session. This is akin to creating a new Server-Side Trace using SQL Trace. However, the Extended Events architecture follows a more formal publisher-subscriber model. This means a single capturing session may provide data to multiple targets of different types such as live streaming viewers or files, whilst generally minimizing the performance impact on the server. We can do this straight from SSMS.
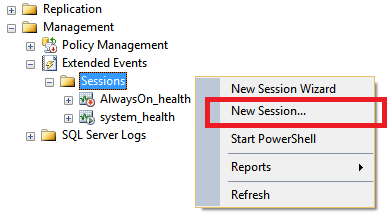
To create a New Session, we need connect to our given server and then find the Extended Events node, under the Management folder, in the SSMS’ Object Explorer window. We have two ways of creating the session from here. We can use either:
- The New Session Wizard
- The New Session window
Whilst the New Session Wizard is meant to be more intuitive, it is a good idea to get acquainted with the vanilla New Session window, as this is the same interface we end up using when updating properties on an existing session.
To access this window, we can right-click on the node and then select New Session… from the menu:
The first thing we need to do here is to name our session. This is the name that will appear under the Extended Events node in SSMS. This is a standard SQL Server identifier so the usual rules apply:
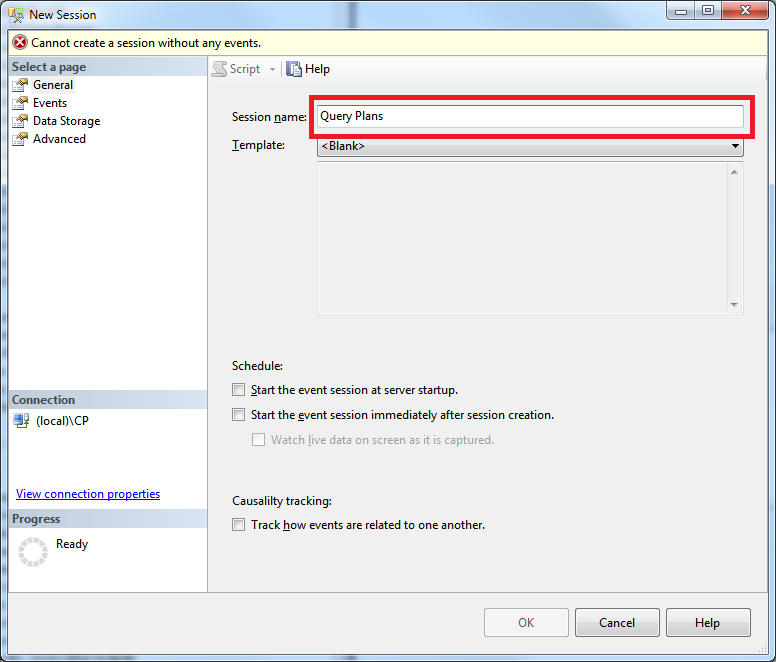
We can also set our new session to start automatically along with the server. However, for the performance reasons already stated, unless we are preparing a mission-critical event session (such as health monitoring), it is a good idea to only turn on a session manually, when we really need to do so.
Having set the name, we can now move to the Events page in this window. This is where we select the events that we wish to capture. If events had physical weight, there would literally be a truckload of events to choose from. If there is one thing SQL Server wants to give us is information. However, it is quite easy to find an event family if we already know part of their name. For our current endeavour, we are interested in capturing query plan generation events. We can bring those up quickly to typing showplan in the Event Library text box:
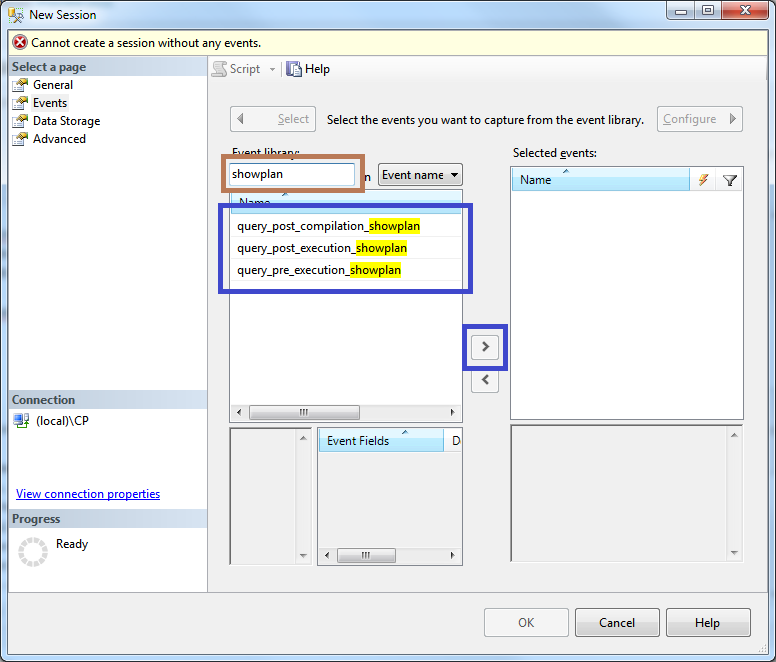
We have previously highlighted the three main events we can use to capture query plan usage. In SQL Trace lingo, these are called:
- *Showplan XML For Query Compile: Raised when the query is first compiled and its estimated plan is produced and put in the query plan cache.
- *Showplan XML: Raised when the estimated plan is selected and prepared to be used by a query.
- *Showplan XML Statistics Profile: Raised when the query finishes and its actual plan is made available.
We can notice the evolution accomplished in Extended Events even in the naming conventions being used. Extended Events provides us with three equivalent events, albeit with much more obvious names. These are:
query_post_compilation_showplan: Equivalent to Showplan XML for Query Compile and captures the initially compiled plan.query_pre_execution_showplan: Equivalent to Showplan XML and captures the chosen estimated plan for query about to be executed.query_post_execution_showplan: Equivalent to Showplan XML Statistics Profile and captures the actual plan for a given query, made available after it is executed.
To select these events for capture, we can highlight them all, using the Shift key, and then click the right arrow button. We can also add other events to our session if we need to. Once we’re happy, we can the click the Configure button to move on:
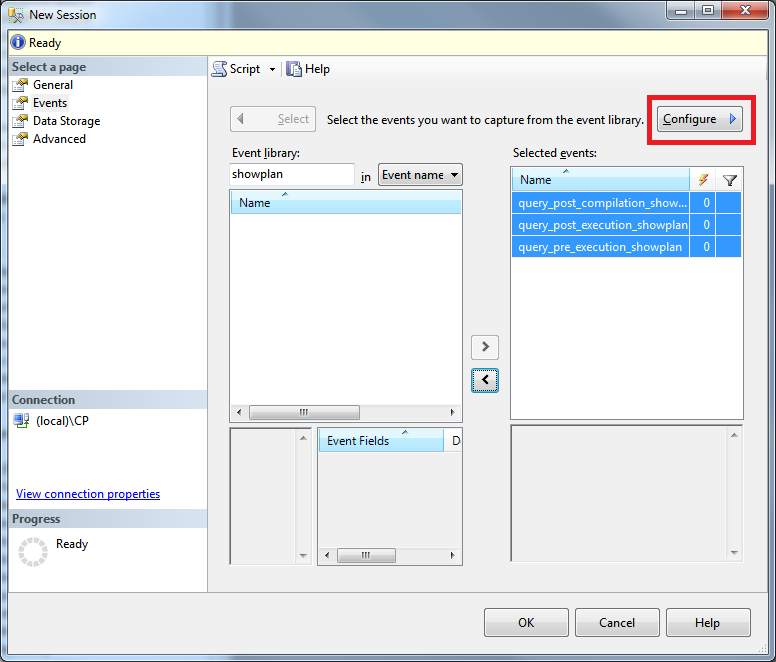
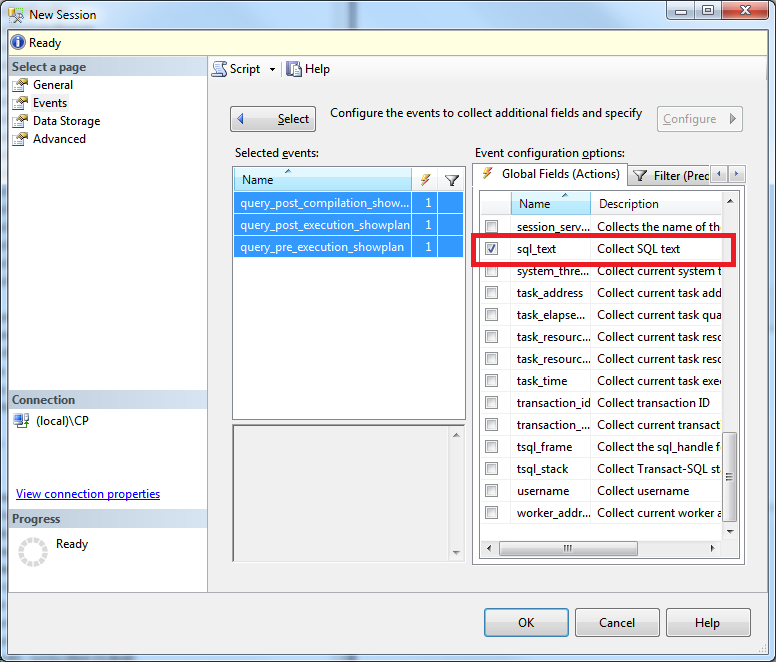
In the following panel, we can choose what properties of an event we want to bring along, in addition to its main purpose. We can select properties such as database_name and username, just as we would do with SQL Trace. A particularly useful one when we are troubleshooting query plans is the sql_text property. This is akin to the TextData property in SQL Trace and contains the executed T-SQL query.
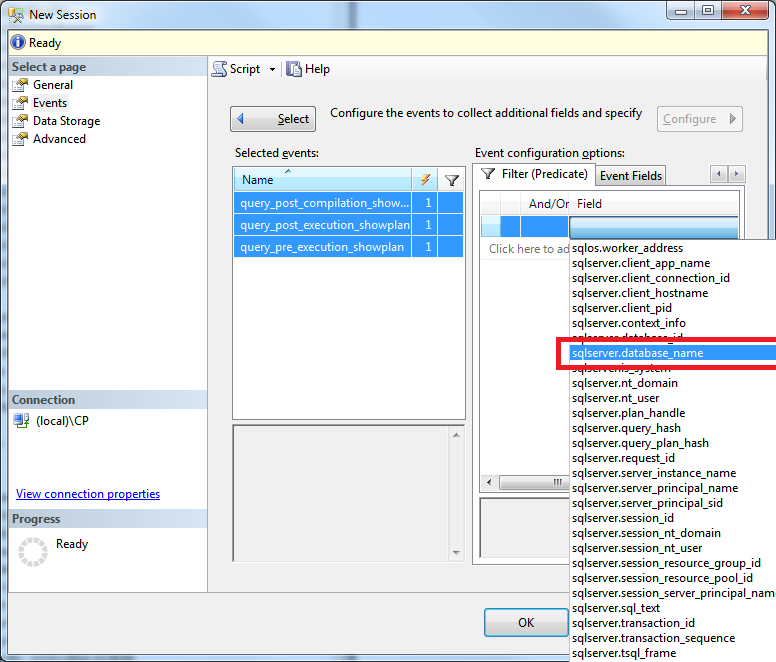
On the Filter (Predicate) tab in this same window, we can set the precise conditions on which we wish to capture events. For example, if we are only interested in capturing data from a single database, we can apply a filter here, which will help both minimize impact on the server’s performance and the impact on our eyes when combing through all the data. To do so, we can select sqlserver.database_name from the Field drop-down box:
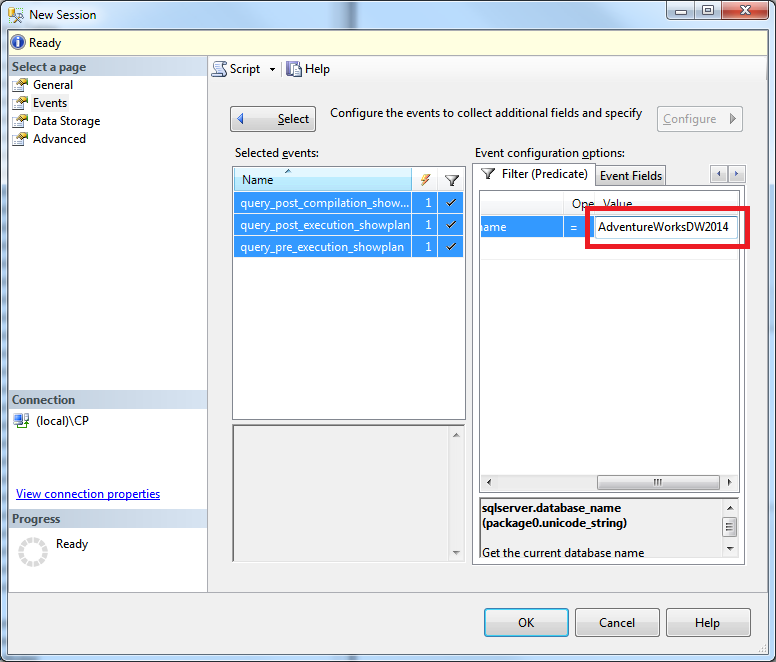
We can then type in the name of our database in the Value, leaving the Operator as the equals sign.
There is a high number of ways we can trigger the capture of events from here, so be sure to play around and explore all the triggers and operators.
Once we’re happy, we can move on the data storage tab. This is the place where we choose one or more targets to provide the data to, by default.
For example, we may want that all the events be written into a file for later analysis. To do so, we can register an event_file target against this session.
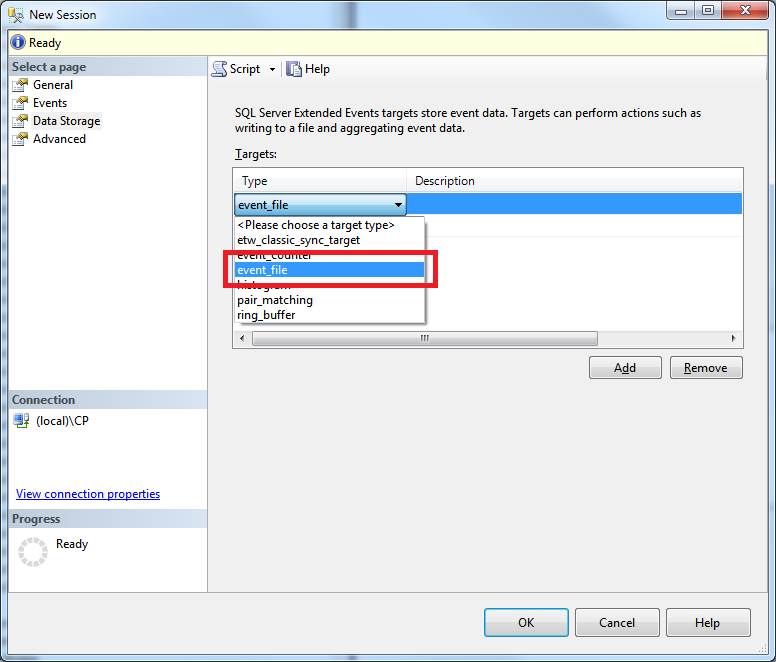
We then only need to specify where that file will de written to:
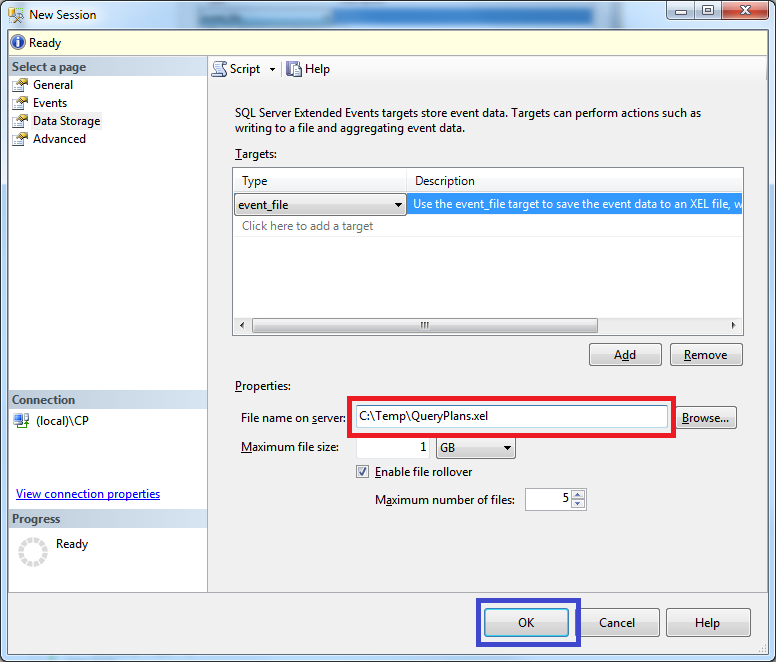
Note that there are other event targets such as those that aggregate data, which can be used for on-the-fly aggregated analysis of the overall impact of certain events. We’ll come back to this in a bit as this functionality can be quite useful in identifying problematic query plans.
Once we’re happy with the session, we can click OK to close the window.
The Live Data Viewer
We can now see the new session under the Extended Events node. This session is stopped at the moment though. To start capturing events we need to start it up. We can do this by right-clicking on it and selecting Start Session:
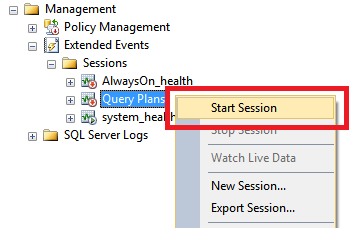
This starts the capturing session, and it becomes available to any client who wishes to subscribe to it. SSMS itself is, of course, such a client. An easy way to subscribe to a running event session is to right-click on it and select Watch Live Data:
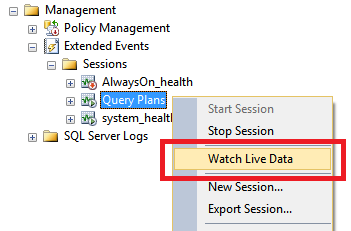
The live event viewer pops up, waiting for something to occur:

So what happens when we run some queries now? Let’s mimic what we did before and see what shows up when run the query below against the AdventureWorksDW2014 database:
DBCC FREEPROCCACHE
GO

SELECT
    DOD.CalendarYear,
    SUM(FIS.TotalProductCost) AS TotalProductCost
FROM
    dbo.FactInternetSales AS FIS
    INNER JOIN dbo.DimDate AS DOD
        ON DOD.DateKey = FIS.OrderDateKey
GROUP BY
    DOD.CalendarYear
GO

SELECT
    DOD.CalendarYear,
    SUM(FIS.TotalProductCost) AS TotalProductCost
FROM
    dbo.FactInternetSales AS FIS
    INNER JOIN dbo.DimDate AS DOD
        ON DOD.DateKey = FIS.OrderDateKey
GROUP BY
    DOD.CalendarYear
GO
The purpose of three-batch script above is to:
1) Clear the query plan cache so we force recompilation to occur. 2) Run a known query for the first time, so we can see what happens. 3) Run the same query again, so we can see what the difference is.
Let’s then see if anything popped up in our Watch Live Data window…
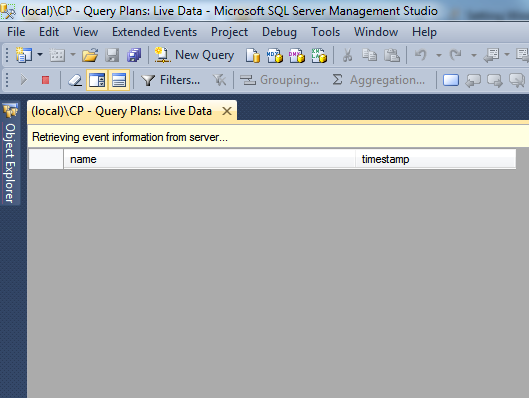
Nothing yet… Now that’s odd, innit?
Well, not really. This is an artefact of the architecture of Extended Events. Unlike SQL Trace, which retrieves events as soon as they are triggered, Extended Events buffers events in an internal cache and only dispatches them to subscribers once that buffer is full.
It seems our puny query and the plans generated by it aren’t nearly enough to fill this buffer and trigger a dispatch to the client. If we were to continue running queries, we’d eventually see those events pop up. However, because we want to focus on the events triggered by our test script, let’s just stop the event session for now. This will force a dispatch of the events in the cache to any connected client such as the Watch Live Data window.
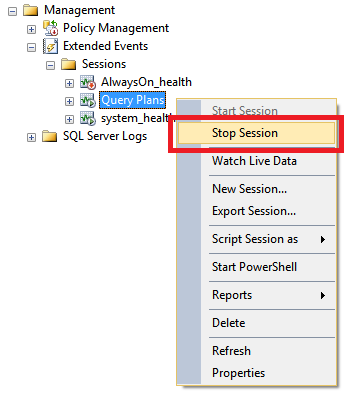
We can do this from Object Explorer by right-clicking on our session and selecting Stop Session:
If now go back to the Watch Live Data window, we can see the expected events have finally popped up. These are listed chronologically by default, from oldest to newest. If you’ve read about gathering events with SQL Profiler, these five events are exactly what you’d expect.
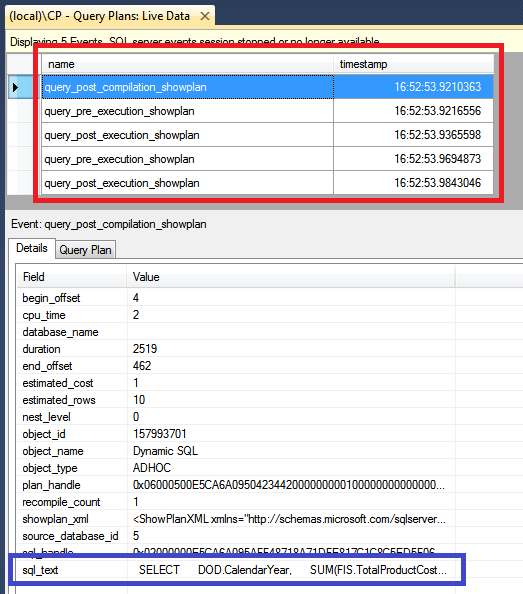
So what happened here again?
-
We ran
DBCC FREEPROCCACHE. This cleared the query plan cache, forcing SQL Server to re-generate plans for any following query. This command generates no fancy query plan, so we won’t see an event for it. - We ran the test query for the first time. This caused three events to fire:
- First,
query_post_compilation_show_planwas fired to tell us a new estimated query plan was generated for this particular query. - Then,
query_pre_execution_show_planwas fired to tell us that plan was selected for this query. - Finally,
query_post_execution_show_planwas fired to tell us the query completed, presenting us the actual plan that was used.
- First,
- We then ran the query a second time. However, this only caused two events to fire:
query_pre_execution_show_planquery_post_execution_show_plan
The initial event, query_post_compilation_show_plan was not fired because this time the estimated query plan was already in cache. Therefore, there was no need to generate a new estimated plan for this execution.
If we want to make sure we’re seeing the right event we can double-click on that sql_text property. We’ll be presented with the query itself as you can see below:
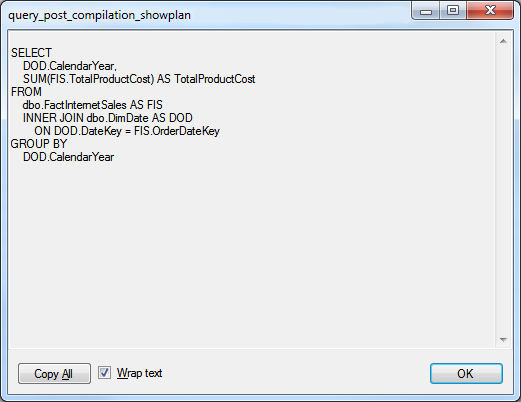
This is the event property we requested when we created the new event session and it tends to be quite useful regardless of the event we’re subscribing to.
The Query Plan
Of course, what is the point of requesting query plan events if we don’t look at the query plans? This is what the Query Plan tab is for. We only have to click on it, and SSMS will show us the query plan for the selected event in its built-in visualizer:
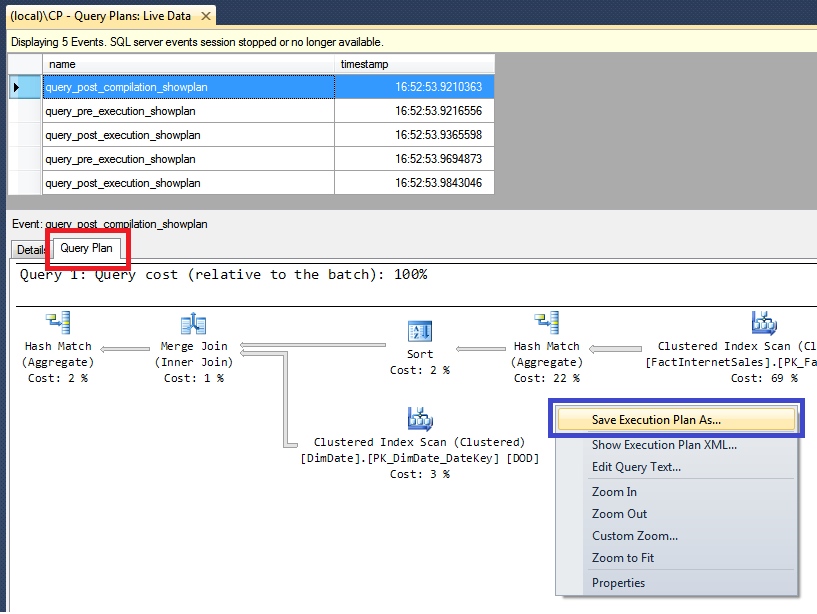
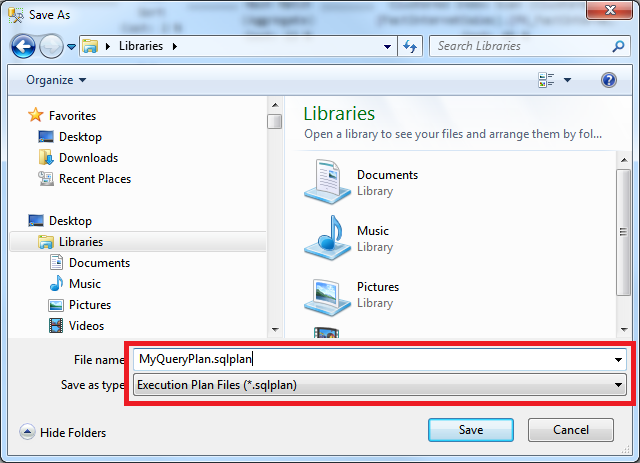
Like with SQL Trace, we can save the Query Plan for future use or perhaps to email our friendly DBA with. Right-clicking on the canvas allows us to do so. We can then save the query plan as .sqlplan file, just like before:
Using T-SQL Script
Creating an Event Session in T-SQL is remarkably simpler than creating a server-side trace in SQL Trace. Unlike the latter, which requires us to juggle a number of overly complicated procedure calls, Extended Events support is built right into T-SQL itself.
Creating the very same session as we saw above is a matter of issuing a single T-SQL statement:
CREATE EVENT SESSION [Query Plans] ON SERVER

/* query plan compilation event */
ADD EVENT sqlserver.query_post_compilation_showplan
(
    ACTION(sqlserver.sql_text)
    WHERE ([sqlserver].[database_name]=N'AdventureWorksDW2014')
),

/* query plan estimated plan selected event */
ADD EVENT sqlserver.query_post_execution_showplan
(
    ACTION(sqlserver.sql_text)
    WHERE ([sqlserver].[database_name]=N'AdventureWorksDW2014')
),

/* query plan actual plan generated event */
ADD EVENT sqlserver.query_pre_execution_showplan
(
    ACTION(sqlserver.sql_text)
    WHERE ([sqlserver].[database_name]=N'AdventureWorksDW2014')
)

/* output to a file */
ADD TARGET package0.event_file(SET filename=N'C:TempQueryPlans')

/* dont start with server */
WITH (STARTUP_STATE = OFF)
To start that session, we can then issue a simple command:
ALTER EVENT SESSION [Query Plans] ON SERVER
STATE = START
Stopping the session is equally simple.
ALTER EVENT SESSION [Query Plans Z] ON SERVER
STATE = STOP
Once we’re done with the session, we can then remove it by running this:
DROP EVENT SESSION [Query Plans Z] ON SERVER
Neat, isn’t it?
Aggregations For The Masses
One of the coolest things of using Extended Events is SSMS’ ability to perform aggregations of the event data for us. Instead of us having to resort to writing T-SQL queries as we’ve seen before, we can create simple reports such as show me the top queries by average CPU cost without having to leave the live data window.
So how can we accomplish this?
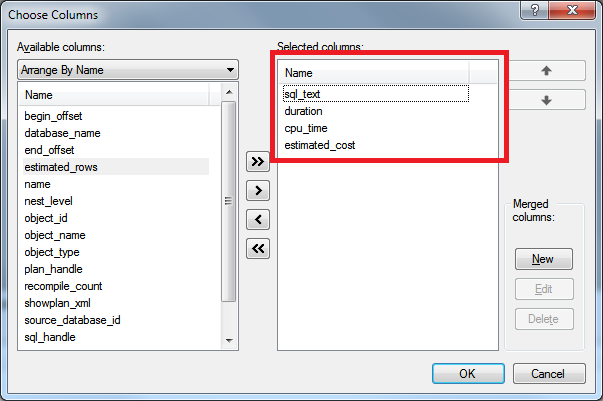
Well, it turns out those two columns we see in the live data window, name and timestamp, are far from being the only ones we can use. To see what other columns are available we can click on the Choose Columns… button in the Extended Events toolbar:

We see there are a number of additional columns we can bring onto the live data window. The columns here come from all the events that have been retrieved by the live data window itself. We can pick and choose the ones we want to consider by moving them to the list box in the right and then clicking OK:
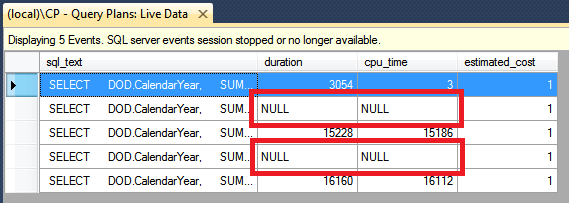
We can now see those columns in the live data window. However, some events don’t have any data for particular columns. In this case they’ll show a NULL instead:
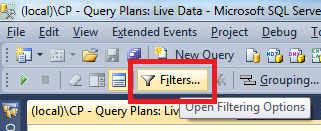
In our current example, we’re only interested in events with a duration and CPU that relate to query execution itself - as opposed to resources taken by, say, plan compilation. We can focus on relevant events by clicking the Filters… button on the Extended Events toolbar:
The Filters window allows us to focus on certain events by applying filter conditions to their columns or defining a time window to zoom into. Since we’re only interested in events in which the duration relates to query processing, let’s add the filter below and click OK:
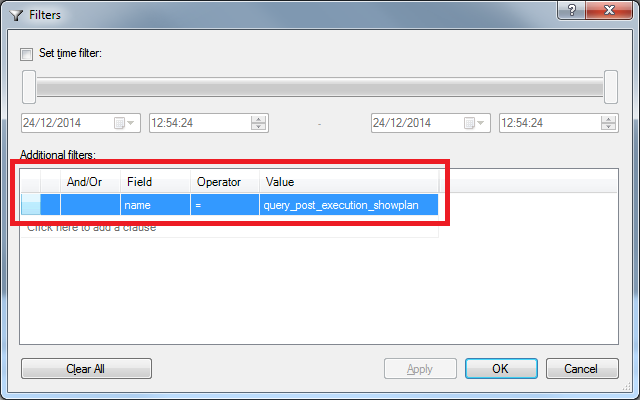
Back to the live data window, we can see the events are now filtered:

There is one important thing to keep in mind here. Setting filters at this stage is very different from setting filters in the New Event Session window. The filters we set here are applied after the events are collected. We might not see them, but they are still collected and still have an impact on the performance of the server.
OK, so we’ve now focused on useful events only, but this still doesn’t fare much as a report. What we want to see is something like average values per each distinct query. To do this, we can click on the Grouping… button in the Extended Events toolbar:

We can now choose one or more columns by which to group events. To group them by plain query text, let’s pick sql_text and then click OK:
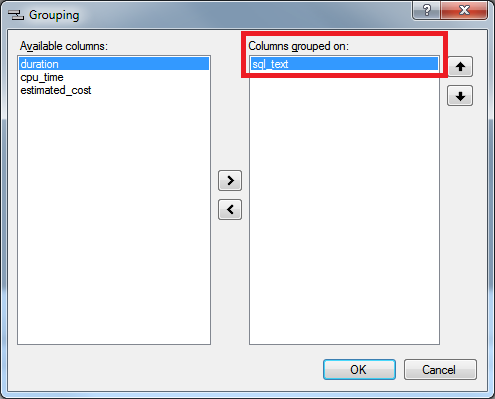
Look at that. Our events are now packed together under a header line holding the query text:

Yet the events are still separate and the values have not been affected. We need to finish this off by applying aggregations. Let’s click the Aggregation… button in the Extended Events toolbar:

Here we can set an aggregation to be applied to each numeric columns in our data window. Let’s set every aggregation here to AVG and then click OK:
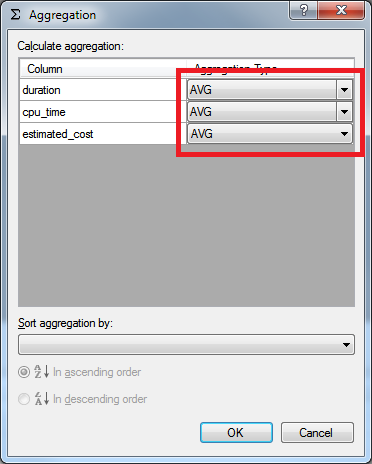
And there we have it. All our data is now grouped nice and shiny:

Granted this is quite a puny example dataset, but this functionality rapidly becomes very valuable when facing a data file with millions of events.
Phew, are we done?
Yep, all done now! Done with the capturing bits, that is, as there is much more to come. We have now gone through all the major ways of surfacing those valuable query plans from the entrails of SQL Server. In the next few posts, we’re going to take a general look at the anatomy of a query plan and understand how it is formed and what makes it tick.