
SQL Trace And The Stream Of Query Plans
In 8 Ways To Hunt T-SQL Query Plans, we looked at some simple ways to get our hands on those valuable query plans. However, sometimes we might want to record query plans as part of a bigger effort to profile and troubleshoot a server, or perhaps optimize it for a given workload.
When this need arises, there are two additional tools we can make use of:
- SQL Trace
- Extended Events
In this article we’ll take a look at how we can use SQL Trace to accomplish this goal.
Before going into that though, there is something really important that we need to keep in mind.
When it comes to grabbing query plans, the use of tracing or extended events can have a significant impact on the performance of the server. How much impact, you ask? Depending on how beefed up (or not) and under pressure (or not) the server is, the impact can range from users barely noticing anything to them calling your support centre like a pot of popping popcorn.
Therefore, we must be wary of using these tools in a production environment! And yes, this includes Extended Events too. The Extended Events feature might, in general, be more lightweight than SQL Trace, but some events still has significant performance impact, and this includes the recording of query plans.
OK, now that we’re done with that boring disclaimer, let’s get on with the fun stuff!
SQL Trace
We have two ways of using SQL Trace to request query plans en-masse from a running server. We can use:
- A client-side SQL Profiler session.
- A server-side trace.
Let’s look at how to use both of these options.
SQL Profiler
To capture query plans with a profiler trace, we need to follow a couple of steps.
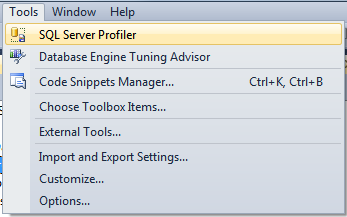
First, if we haven’t done so yet, we need to fire up SQL Server Profiler. This can be done from SSMS by clicking on the [Tools] > [SQL Server Profiler] menu entry.
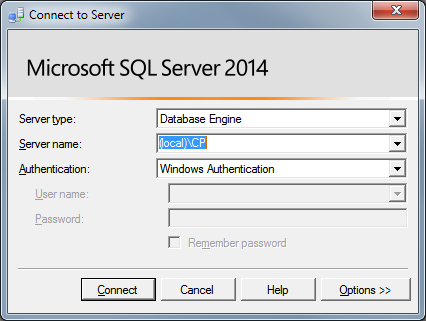
Now we need to connect the Profiler to the server we wish to retrieve query plans from. A login pop-up will immediately appear for that effect.
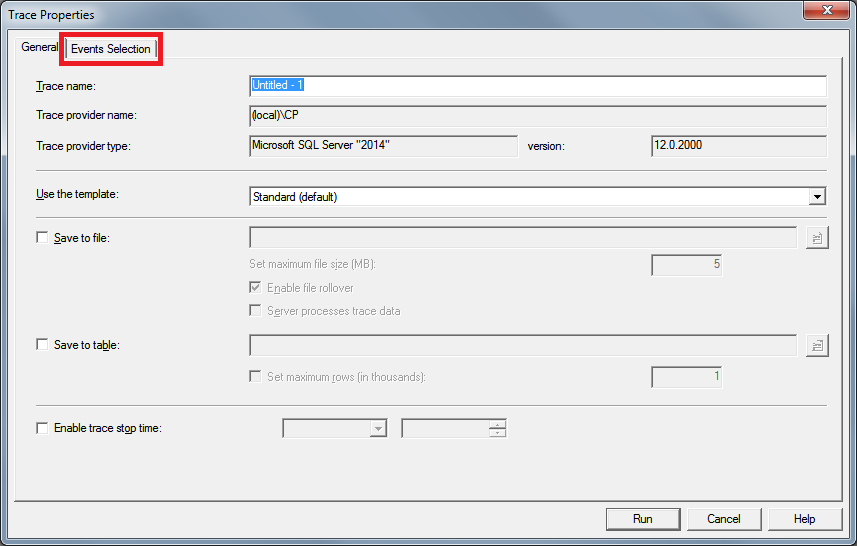
The Trace Properties window opens up automatically. Here, we need to click on the Event Selection tab.
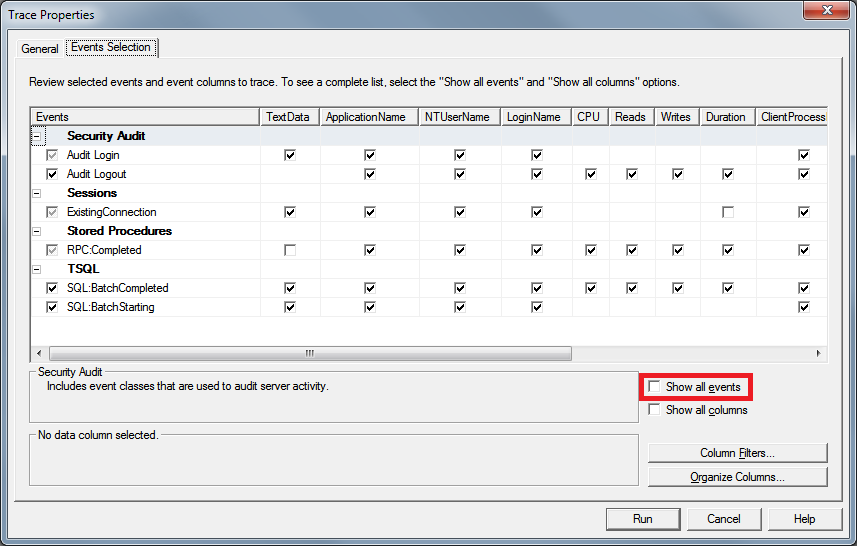
We are presented with the events the default trace profile cares about. Well, we care about a couple of events which aren’t listed, so we need to check Show all events to be able to see them.
We now need to look for the Performance category and expand it:
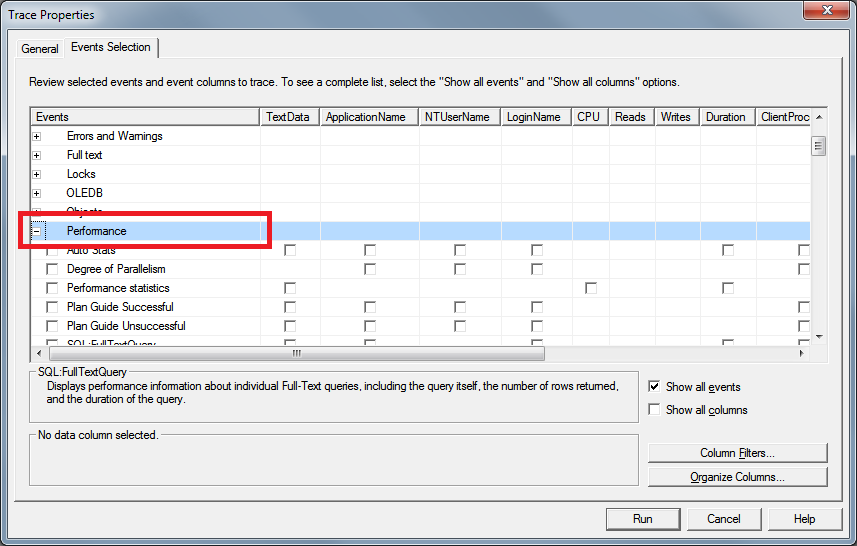
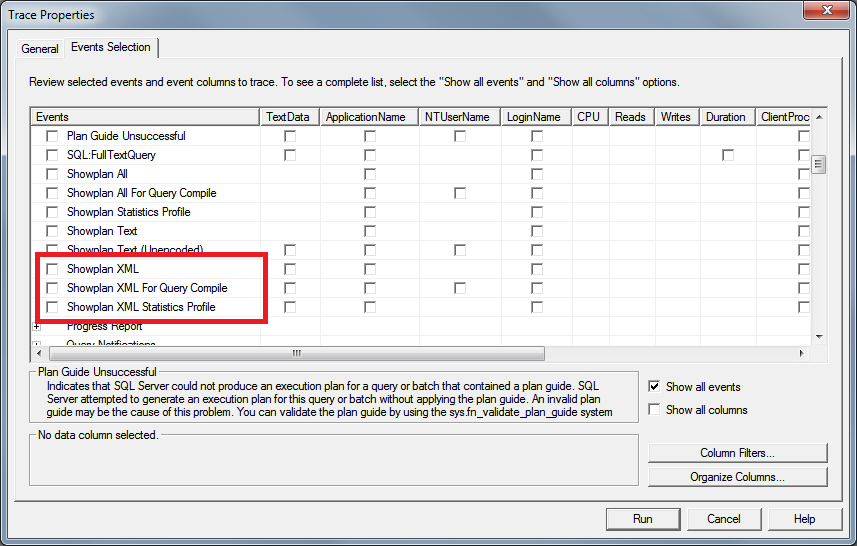
We have a number of events in this list. Do you notice how they curiously mirror the SET SHOWPLAN options we saw in 8 Ways To Hunt T-SQL Query Plans? Three events are of particular interest here:
To understand these events, we need to remember the nature of a trace. A trace is not only intended to show us what steps happened during a certain workload. It is also intended to show us when those steps happened and, following that, roughly in what order they happened.
These three events support that purpose. This is how they work:
1) Showplan XML For Query Compile
This event is raised when a query is compiled and its estimated plan is produced and put in the query plan cache. Usually, SQL Server will re-use the same plan for identical looking queries, so we should expect to see this event only for the first time a given query is executed.
Tip: The corollary here is that if we see this event every single time before the same query, it is an indication that its plan is always being re-compiled during each run and therefore not cached. Unless we’re purposefully using parameter sniffing or forced recompilation (which we’ll look into in later), this might be a performance red flag we need to look into.
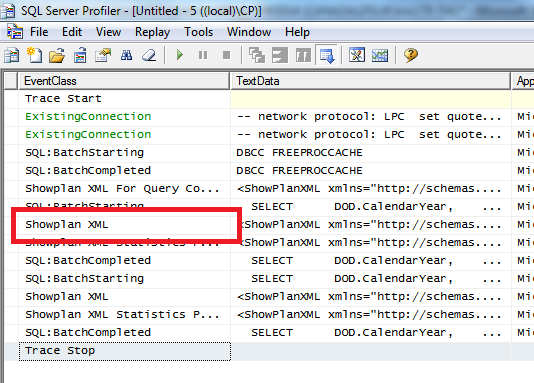
2) Showplan XML
This event is raised when the estimated plan is selected for a query. This is the same plan as produced during the Showplan XML For Query Compile event, with the addition of actual metrics set to zero.
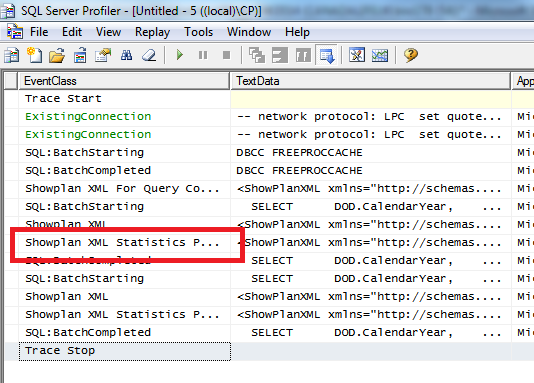
3) Showplan XML Statistics Profile
This event is raised when the query finishes and its actual plan is made available.
On The Screen
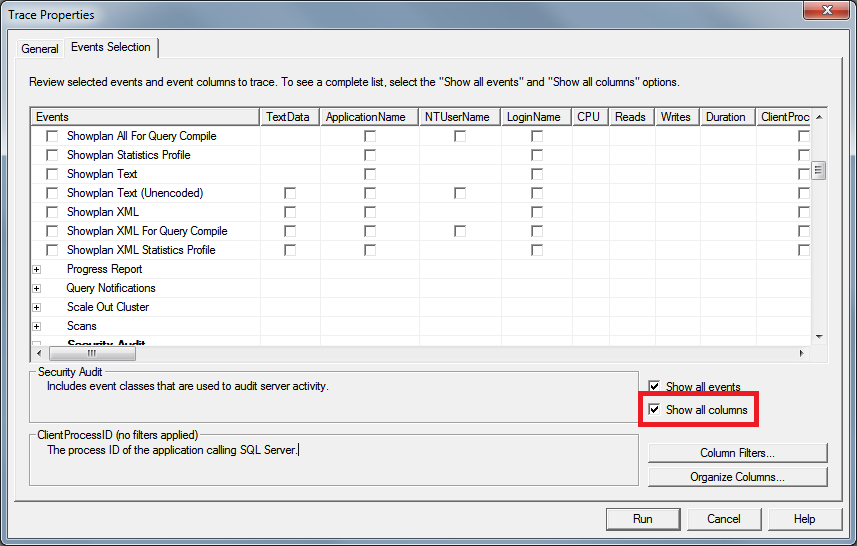
Let’s capture a couple of these events now. Before that though, to minimize the toll on the server, it’s a good idea to filter the statements we want to analyse to the bare minimum. In this example, we’re going to run a query over the sample AdventureWorksDW database, so let’s focus on events from that database only.
First, we need to click on Show all columns so we have the database filter available:
Then, we need to click on Column Filters… so we can see the ones available:
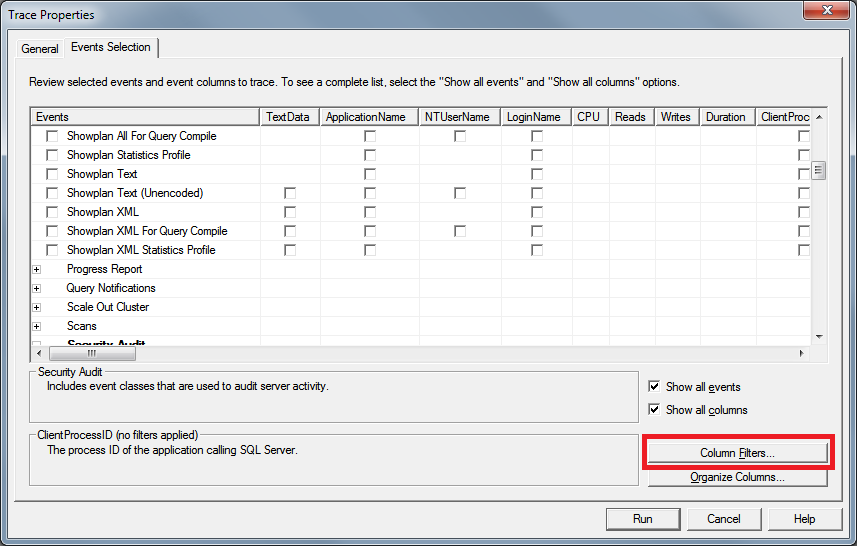
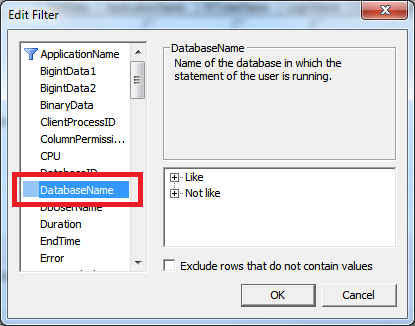
The Edit Filter window opens up. Here, select the DatabaseName filter:
And then add an appropriate mask to the filter. Note that this works just as a LIKE clause in T-SQL:
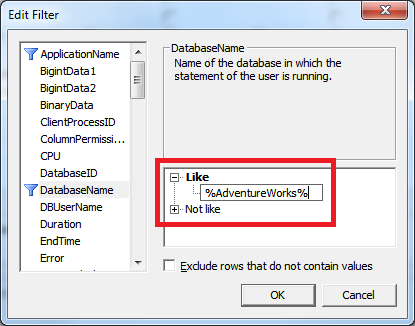
These simple steps will ensure we’re only requesting query plans from the target database and not from other databases on the server as well. In a real-life situation, it is a good idea to be even more restrictive and add other filters, in order to minimize the data being retrieved from SQL Server.
Now that this is taken care of, we can click the OK button here.
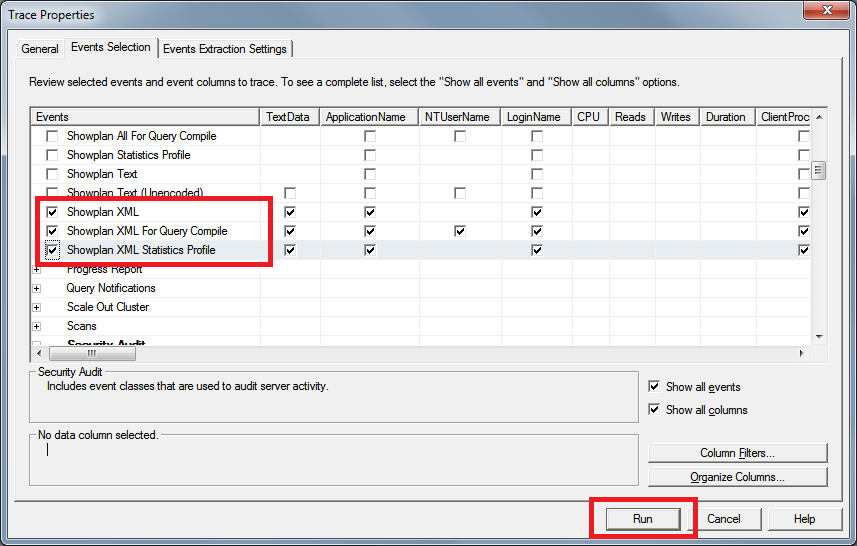
For demonstration purposes, let’s see what all these three XML events look like. Let’s select all three on the Trace Properties window, and click Run:
Now, let’s switch to an SSMS window and run the T-SQL below against the AdventureWorksDW database:
DBCC FREEPROCCACHE
GO

SELECT
    DOD.CalendarYear,
    SUM(FIS.TotalProductCost) AS TotalProductCost
FROM
    dbo.FactInternetSales AS FIS
    INNER JOIN dbo.DimDate AS DOD
        ON DOD.DateKey = FIS.OrderDateKey
GROUP BY
    DOD.CalendarYear
GO

SELECT
    DOD.CalendarYear,
    SUM(FIS.TotalProductCost) AS TotalProductCost
FROM
    dbo.FactInternetSales AS FIS
    INNER JOIN dbo.DimDate AS DOD
        ON DOD.DateKey = FIS.OrderDateKey
GROUP BY
    DOD.CalendarYear
GO
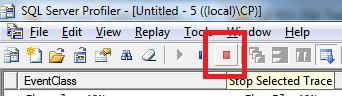
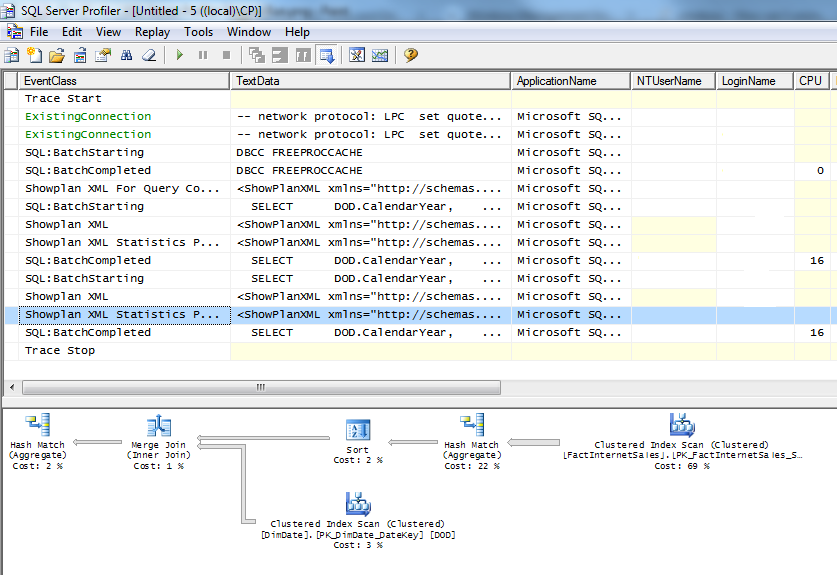
Now let’s switch to the SQL Server Profiler window. At this time we can stop the trace by clicking the Stop Button on the toolbar:
These are the results of the profiler:
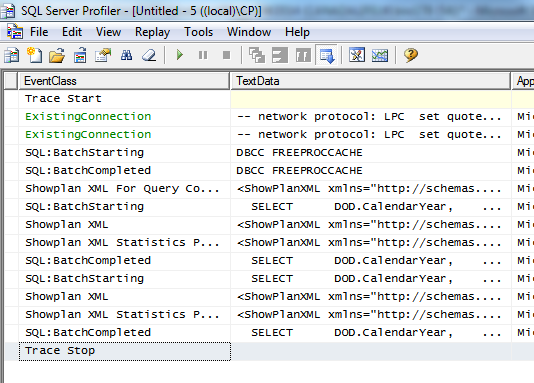
Can you deduce what’s going on here? Let’s take a look at each step and see what is happening.
Compilation
Do you remember that we ran DBCC FREEPROCCACHE? This cleared all the query plans from cache, forcing SQL Server to prepare new ones for incoming queries. This also forced this event to happen:
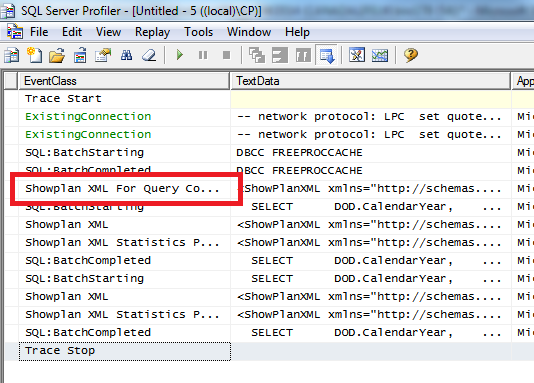
The Showplan XML for Query Compile event tells us that the query was compiled for the first time here, and potentially put into cache. Now hold this thought for a bit.
Next, the Showplan XML event appears. This event tells us that the estimated query plan has been selected for this query. This happens to be the plan created just before.
Finally, the Showplan XML Statistics Profile event appears. This event tells us that, the query having finished, the actual query plan has now been generated and is available for us to look at.
Now let’s look at the second block. This is where we ran the same query for the second time. Do you notice something different? Or rather, the lack of something?
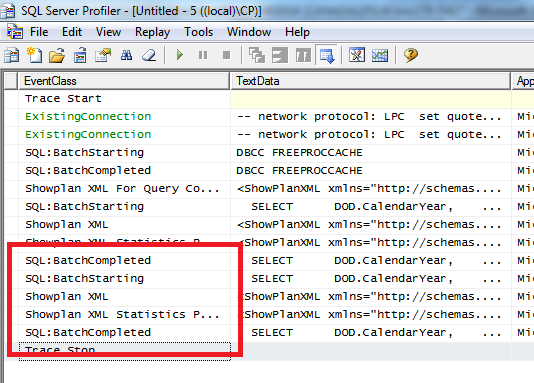
That’s right, the Showplan XML for Query Compile event did not appear in this block. This is because the estimated plan was successfully retrieved from cache, eliminating the need to recompile the query.
Retrieving The Plans
These events would arguably be useless if they didn’t provide a way for us to look at the respective query plans. Luckily, doing so is surprisingly easy. When we click in each of these Showplan events in SQL Profiler, we can immediately visualize its query plan in the bottom pane:
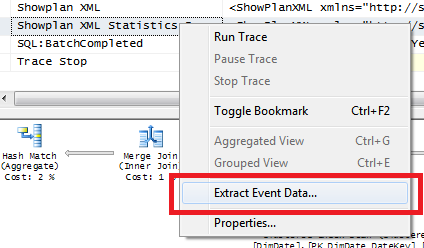
But what if we need to take these query plans somewhere else? Maybe we have to send them by email so our friendly DBA can take a look at them, or maybe just save them for future reference for some reason. Luckily again, saving the query plans from SQL Profiler is very simple. We just need to right-click on the event and select Extract Event Data:
And by doing so, we can then save the query plan as a .sqlplan file:
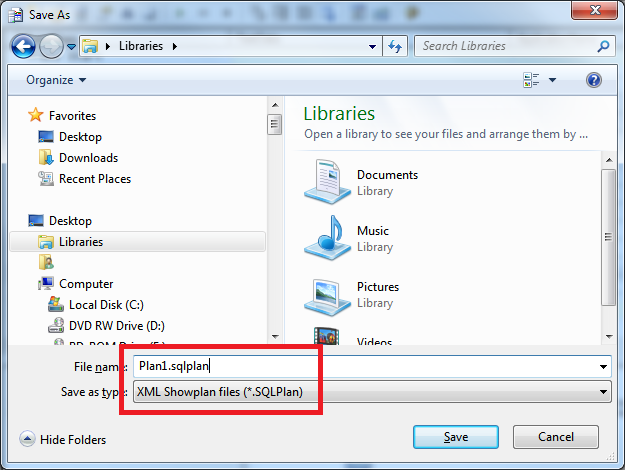
We can then use SSMS or other third-party tools such as SQL Sentry Plan Explorer to explore the plan further.
Server-Side Trace
Capturing query plans using a server-side trace involves writing a bit of T-SQL.
This T-SQL can become very cumbersome very quickly when we are capturing a great number of events and columns. Fortunately, there is a way of simplifying this, which we’ll take a look at in the end.
First, let’s see how we could do this manually (if we really, really, really had to).
Create A Trace
The first step is to create a trace definition in the target server. We do this by running the sp_trace_create stored procedure:
DECLARE @TraceID INT;

/* create a new trace */
DECLARE @MaxFileSize BIGINT = 10; /* MB */
EXECUTE sp_trace_create
	@TraceID = @TraceID OUTPUT,
	@Options = 0,
	@TraceFile = N'C:TempMyTrace',
	@MaxFileSize = @MaxFileSize,
	@StopTime = NULL;

/* show the trace id for future reference */
SELECT
	TraceID = @TraceID;
This procedure creates a trace definition and returns its identifier to us in an output variable. We need to hold on to this identifier so we can configure this trace properly. It’s also a good idea to print this identifier out, so we can easily come back to it as we manage the trace.
Add Events And Columns
The second step is to define what events and columns we wish to see in the trace. This is where it gets really cumbersome. We need to add a call to sp_trace_setevent for every single column of every single event we want to retrieve.
For example, to request the EventClass and TextData columns of the Showplan XML event, we need to add two calls to this stored procedure, like this:
/* request the event class column */
EXECUTE sp_trace_setevent
    @TraceID = @TraceID,
    @EventID = 122,
    @ColumnID = 27,
    @On = 1;

/* request the text data column */
EXECUTE sp_trace_setevent
    @TraceID = @TraceID,
    @EventID = 122,
    @ColumnID = 1,
    @On = 1;
The full @EventID and @ColumnID reference can be found at MSDN but you probably needn’t bother, as we’ll see a quick way of simplifying this. Also continue reading for a longer example of adding the main Showplan events manually (if you really need to).
Start The Trace
The third step is to start the trace. We do this with a call to sp_trace_setstatus:
EXECUTE sp_trace_setstatus
    @TraceID = @TraceID,
    @Status = 1 /* on */
At this point, the trace will start and will keep running in the background. It will stop when the maximum file size has been reached (defined by the @MaxFileSize variable when the trace was created) or we manually tell SQL Server to stop it.
Stop The Trace
You may have already deduced how to stop a trace by now. That’s right, we can stop a trace by calling sp_trace_setstatus again with a different status flag:
EXECUTE sp_trace_setstatus
    @TraceID = @TraceID,
    @Status = 0 /* off */
When we do this, SQL Server stops the trace yet keeps the trace definition active. This means we can reactive the trace if we need to, without having to re-create it from scratch. However, it is always a good idea to remove a trace after we’re done with. The less garbage we leave in the server, the better.
Remove The Trace
When we are done with the trace, we can tell SQL Server to remove it by calling sp_trace_setstatus again:
EXECUTE sp_trace_setstatus
    @TraceID = @TraceID,
    @Status = 2 /* remove */
This will permanently remove the trace. We’ll have to re-create it if we wish to use it again.
Help! I Forgot The TraceID!
Chillax, it’s cool. Just run this:
SELECT * FROM sys.fn_trace_getinfo(0)
This table function returns information for all traces currently defined (running or not). It will give us the TraceID value we need, in case we forgot to print it out or we need to check for a rogue trace we forgot to stop.
Full Example
Here is an example of how we can put this together. This script:
- Creates a new trace.
- Requests the three main query plan events.
- Request a couple of basic columns.
- Starts the trace.
DECLARE @TraceID INT;

/* create a new trace */
DECLARE @MaxFileSize BIGINT = 10; /* MB */
EXECUTE sp_trace_create
	@TraceID = @TraceID OUTPUT,
	@Options = 0,
	@TraceFile = N'C:TempMyTrace',
	@MaxFileSize = @MaxFileSize,
	@StopTime = NULL;

/* show the trace id for future reference */
SELECT
	TraceID = @TraceID;

/* request the showplan xml event */

/* request the event class column */
EXECUTE sp_trace_setevent
	@TraceID = @TraceID,
	@EventID = 122,
	@ColumnID = 27,
	@On = 1;

/* request the text data column */
EXECUTE sp_trace_setevent
	@TraceID = @TraceID,
	@EventID = 122,
	@ColumnID = 1,
	@On = 1;

/* request the start time column */
EXECUTE sp_trace_setevent
	@TraceID = @TraceID,
	@EventID = 122,
	@ColumnID = 14,
	@On = 1;

/* request the end time column */
EXECUTE sp_trace_setevent
	@TraceID = @TraceID,
	@EventID = 122,
	@ColumnID = 14,
	@On = 1;


/* request the showplan xml for query compile event */

/* request the event class column */
EXECUTE sp_trace_setevent
	@TraceID = @TraceID,
	@EventID = 168,
	@ColumnID = 27,
	@On = 1;

/* request the text data column */
EXECUTE sp_trace_setevent
	@TraceID = @TraceID,
	@EventID = 168,
	@ColumnID = 1,
	@On = 1;

/* request the start time column */
EXECUTE sp_trace_setevent
	@TraceID = @TraceID,
	@EventID = 168,
	@ColumnID = 14,
	@On = 1;

/* request the end time column */
EXECUTE sp_trace_setevent
	@TraceID = @TraceID,
	@EventID = 168,
	@ColumnID = 14,
	@On = 1;


/* request the showplan xml statistics profile event */

/* request the event class column */
EXECUTE sp_trace_setevent
	@TraceID = @TraceID,
	@EventID = 146,
	@ColumnID = 27,
	@On = 1;

/* request the text data column */
EXECUTE sp_trace_setevent
	@TraceID = @TraceID,
	@EventID = 146,
	@ColumnID = 1,
	@On = 1;

/* request the start time column */
EXECUTE sp_trace_setevent
	@TraceID = @TraceID,
	@EventID = 146,
	@ColumnID = 14,
	@On = 1;

/* request the end time column */
EXECUTE sp_trace_setevent
	@TraceID = @TraceID,
	@EventID = 146,
	@ColumnID = 14,
	@On = 1;


/* filter the trace */
EXECUTE sp_trace_setfilter
	@TraceID = @TraceID,
	@ColumnID = 35, /* database name */
	@Logical_Operator = 0, /* and */
	@Comparison_Operator = 6, /* like */
	@Value =N'%AdventureWorks%';

/* start the trace */
EXECUTE sp_trace_setstatus
	@TraceID = @TraceID,
	@Status = 1 /* on */
The Easy Way
Now that we’ve seen this script, I dare say we’re allowed to forget it. This was for understanding purposes only. Because we now know how to request query plans using SQL Profiler, it’s a simple task to convert our Profiler Trace to a Server-Side Trace script:
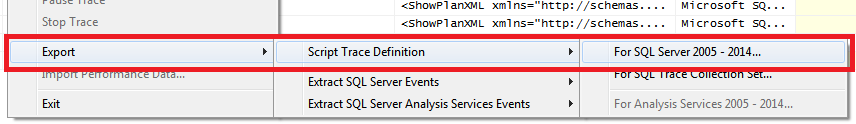
Yep, that’s a menu item right there. It’s as easy as that.
Great! I learned the details of stuff I’m not supposed to use!
Yes we did! Who said we couldn’t break the rules in SQL Server? In the next pumpkin, we’ll learn even more stuff we’re not supposed to use, when we start grabbing query plans using Extended Events. Why? Because We Can. So there.