
8 Ways To Hunt T-SQL Query Plans
In How Can Query Plans Help Us? we looked at how query plans can be made to help us troubleshoot a runaway query. Then in Are Query Plans All We Need? we looked at other tools we need to keep ready in our performance tuning utility belt. With that in mind, it is now time to understand how we can capture query plans to begin with.
So Where Do We Start?
To understand how we can capture query plans, we must first understand what types of query plans are there to capture. Luckily, there is only two of them.
They are:
- The Estimated plan
- The Actual plan.
So what’s the difference between them?
The Estimated Plan
When we request an Estimated plan for a given query, SQL Server will generate a plan for us with a few caveats, namely:
- SQL Server will not run the query.
- Some measures are only an estimation, such as:
- Rows processed by each operator.
- Number of executions of each operator.
An Estimated query plan is useful in some circumstances such as when:
- We don’t want to run the query for some reason.
- The query takes too long to complete for us to get the actual plan.
The Actual Plan
When we request an actual plan for a query, we remove the shackles we put on SQL Server when requesting the estimated plan. We do need to consider some other caveats, namely:
- SQL Server will run the query.
- SQL Server will perform runtime decisions such as:
- Degree of Parallelism
- Memory Grants
- SQL Server will record runtime information such as:
- Actual number of rows processed by each operator.
- Actual number of executions of each operator.
- SQL Server will still bring along estimations for comparison.
Because it is significantly more complete, the Actual plan tends to be more valuable than the Estimated plan. However, for SQL Server to be able to show the actual plan for a query, it does need to be able to complete that query as well. This makes the actual plan impractical to generate for:
- Very time-consuming queries.
- Queries we don’t want to execute in the first place.
Note that, when it comes to estimated versus actual query plans, one is not necessarily better than the other every time. Sometimes, it can be interesting to generate both and then compare the differences between them, in an effort to understand how SQL Server “changed its mind” between preparing to run and actually running the query.
Covered? Cool. So let’s go capture some query plans!
Hunting That Query Plan
So in what ways can we capture query plans? Funny enough, quite a few, even if the majority are deprecated.
Let’s go through them one by one. The screens below show us what each method returns, given the following example query being run over the _AdventureWorksDW2014 database on my own machine.
SELECT
    DOD.CalendarYear,
    SUM(FIS.TotalProductCost) AS TotalProductCost
FROM
    dbo.FactInternetSales AS FIS
    INNER JOIN dbo.DimDate AS DOD
        ON DOD.DateKey = FIS.OrderDateKey
GROUP BY
    DOD.CalendarYear
SET SHOWPLAN_TEXT
When we enable this option, SQL Server returns an estimated query plan in a textual format. SQL Server will not execute queries while this option is enabled.
To enable this option, we only need to run the code below in our session.
SET SHOWPLAN_TEXT ON
GO
Do you notice the GO? It’s there because the family of SET SHOWPLAN options must be the only ones in a batch.
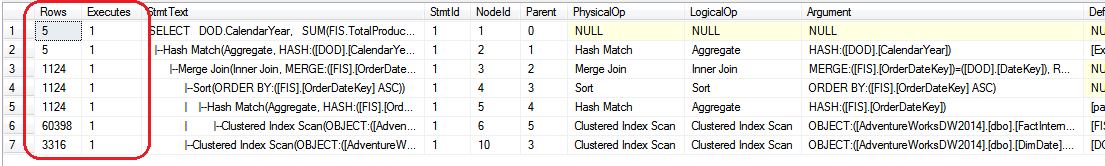
The output of SET SHOWPLAN_TEXT looks like this:
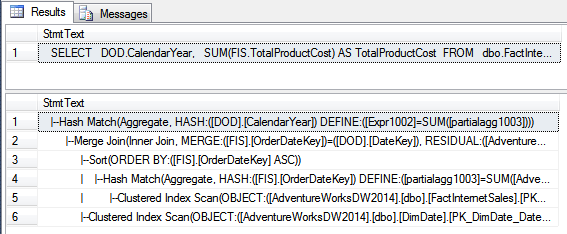
As we can see, SET SHOWPLAN_TEXT returns two result sets:
- A result set containing the executed T-SQL.
- A result set containing the query plan hierarchy in a plain text format, one operator per row.
Note: SHOWPLAN_TEXT is deprecated, so although you can use it, try not to make new projects dependant on it.
SET SHOWPLAN_ALL
When we enable this option, SQL returns the estimated query plan in a plain text format, just like with SET SHOWPLAN_TEXT, plus estimations on the resource consumption of each step in the plan. SQL Server will not execute queries while this option is enabled.
Enabling this option is similar to before:
SET SHOWPLAN_ALL ON
GO
The output of SET SHOWPLAN_ALL is a bit different from before though:
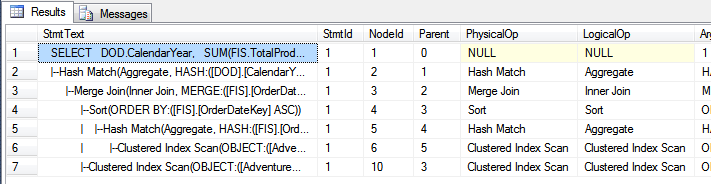
The output is actually quite wider than can be shown here. It adds a number of interesting columns such as:
- Estimated Rows
- Estimated IO
- Estimated CPU
- Average Row Size
- Total Subtree Cost
- Estimated Executions
Note: SHOWPLAN_TEXT is also deprecated, so you know the score.
SET SHOWPLAN_XML
This option is the preferred - and non-deprecated - method of requesting the estimated plan in a text format. When we enable this option, SQL Server returns a nicely formatted XML file that can be either manually opened or shown in a graphical visualizer, such as SSMS’ built-in visualizer or SQL Sentry Plan Explorer.
So, have you guessed how to enable this option?
SET SHOWPLAN_XML ON
GO
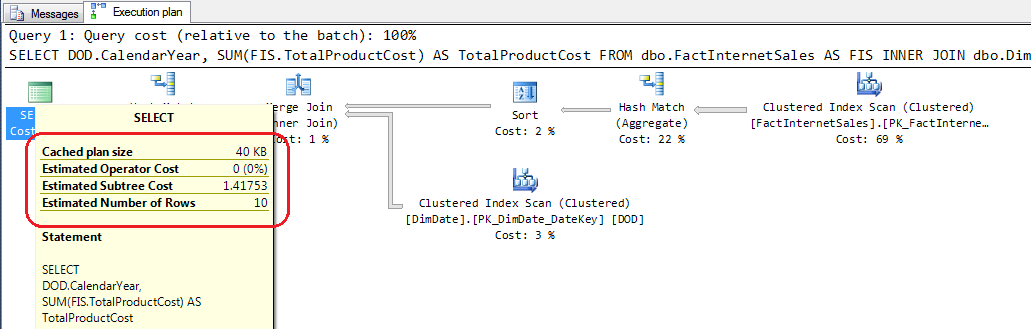
Have you also guessed what the result of enabling this will be?
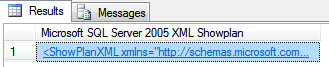
Doesn’t look like much, does it? Yet, what we are looking at is a properly formatted XML file, according to a schema SSMS understands. We can see the magic happen by simply clicking on that column value.
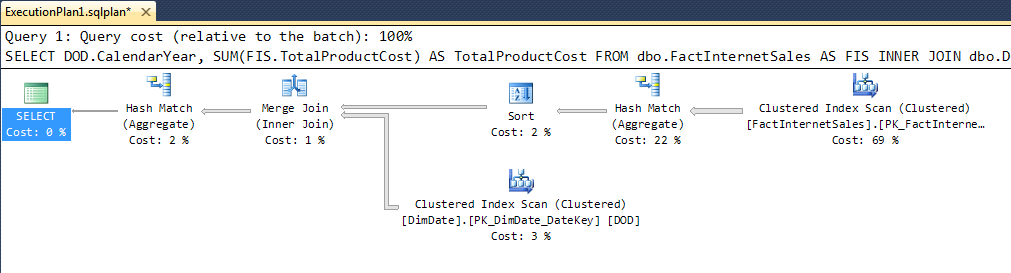
And voilà. The Graphical Visualizer appears. How neat is that?
sys.dm_exec_query_plan
This DMV is quite neat too. With the help of a couple of others, we can use it to:
- See the estimated XML plan of currently running queries in any session.
- See the estimated XML plan of previously executed queries for which the plan is still in cache.
- See the actual XML plan of previously executed queries, if SQL Server happens to have gathered execution statistics on it.
- With some creativity, gather insight such as what recent queries took the highest toll on SQL Server, using different criteria.
Let’s look at different ways of using this DMV.
Estimated XML Plan For All Executing Queries
SELECT
    r.session_id,
    r.command,
    s.login_name,
    qp.query_plan
FROM
    sys.dm_exec_requests AS r
    INNER JOIN sys.dm_exec_sessions AS s
        ON s.session_id = r.session_id
    CROSS APPLY sys.dm_exec_query_plan(r.plan_handle) AS qp
Estimated XML Plan For Target Active Session
As you might have guessed, this is as easy as adding a filter to the previous statement.
SELECT
    r.session_id,
    r.command,
    s.login_name,
    qp.query_plan
FROM
    sys.dm_exec_requests AS r
    INNER JOIN sys.dm_exec_sessions AS s
        ON s.session_id = r.session_id
    CROSS APPLY sys.dm_exec_query_plan(r.plan_handle) AS qp
WHERE
    s.session_id = 99
Estimated XML Plans Still In Cache
If we are curious to see what plans are consuming the most cache memory in SQL Server, we can run something like the query below.
SELECT
    cp.*,
    qp.query_plan
FROM
    sys.dm_exec_cached_plans as cp
    CROSS APPLY sys.dm_exec_query_plan(cp.plan_handle) AS qp
ORDER BY
    cp.size_in_bytes DESC
Estimated XML Plans Still In Cache Plus Statistics
If we are looking at recent query statistics from the server and want to tack along the estimated plan, we can do it in the same fashion as before:
SELECT
    qs.*,
    qp.query_plan
FROM
    sys.dm_exec_query_stats as qs
    CROSS APPLY sys.dm_exec_query_plan(qs.plan_handle) AS qp
ORDER BY
    last_execution_time DESC
Getting Creative
Since this is a DMV that plays well with others, we can also get a bit creative with it - especially when we don’t know exactly what to troubleshoot yet.
For example, with a simple query, we can gather the query plans for the TOP 10 queries with the highest average CPU consumption:
SELECT TOP 10
    qs.total_worker_time / qs.execution_count AS average_cpu_time,
    query_plan
FROM
    sys.dm_exec_query_stats AS qs
    CROSS APPLY sys.dm_exec_query_plan(qs.plan_handle) as qp
ORDER BY
    average_cpu_time DESC;
Or, in the same fashion, the TOP 10 with the most average logical reads:
SELECT TOP 10
    qs.total_logical_reads / qs.execution_count AS average_logical_reads,
    query_plan
FROM
    sys.dm_exec_query_stats AS qs
    CROSS APPLY sys.dm_exec_query_plan(qs.plan_handle) as qp
ORDER BY
    average_logical_reads DESC;
Now isn’t that useful?
sys.dm_exec_text_query_plan
On first sight, this DMV appears almost identical to the previous sys.dm_exec_query_plan. The only practical difference is that it returns the plan contents in an NVARCHAR(MAX) column as opposed to an XML column. The text content itself is still formatted XML.
So what’s the point, you might ask?
It turns out there are a couple of annoyances with sys.dm_exec_query_plan that sys.dm_exec_text_query_plan tries to address.
#1: Have you ever encountered this?

Unfortunately, SQL Server’s XML data type has a limitation of 128 nesting levels. Some query plans can become so complex that their XML representation goes beyond this limit. This makes it impossible for us to retrieve the query plan in XML form.
sys.dm_exec_text_query_plan addresses this by returning the plan in text form, specifically in an NVARCHAR(MAX) column which, being simple text, has no nesting issues to begin with.
#2: sys.dm_exec_query_plan gives us the query plan for the whole batch. This might be fine for a query with a single to a couple of statements. However, if we try troubleshooting a stored procedure with 30 odd statements we can quickly find ourselves spending more time finding our target statement in the XML plan than fixing it in the first place.
sys.dm_exec_text_query_plan addresses this by allowing us to slice off the plan for a particular statement out of the full query plan. We do this by providing start and end offsets to it. We can get these offsets from two other DMVs:
sys.dm_exec_query_statssys.dm_exec_requests
With these differences in mind, we can get even more creative.
For example, the query below brings up the statements with the longest average running time. For each statement, the query then brings the query plan for that statement only. We also convert the query plan’s text back to XML so we can open it in SSMS just as before.
WITH XMLNAMESPACES (DEFAULT N'http://schemas.microsoft.com/sqlserver/2004/07/showplan')
SELECT
    query_text = st.text,
    average_worker_time = (qs.total_worker_time / qs.execution_count),
    query_plan_xml = CAST(qp.query_plan AS XML),
    query_plan_text = qp.query_plan,
    qs.execution_count
FROM
    sys.dm_exec_query_stats as qs
    CROSS APPLY sys.dm_exec_text_query_plan(qs.plan_handle, qs.statement_start_offset, qs.statement_end_offset) AS qp
    CROSS APPLY sys.dm_exec_sql_text(qs.sql_handle) AS st
WHERE
    qp.query_plan LIKE '%SELECT%'
    AND qp.query_plan NOT LIKE '%CREATE PROCEDURE%'
    AND qp.query_plan NOT LIKE '%CREATE FUNCTION%'
ORDER BY
    (qs.total_worker_time / qs.execution_count) DESC
SET STATISTICS PROFILE
This SET option is very similar to SET SHOWPLAN_ALL, but instead of returning the estimated plan, SET STATISTICS PROFILE executes the query and then returns the actual plan, along with two extra bits of information:
- The actual number of rows produced by each operator.
- The number of times the operator has been executed.
Enabling this option is as easy as before.
SET STATISTICS PROFILE ON
Unlike the SET SHOWPLAN options, we can use SET STATISTICS PROFILE in the current batch.
See those two new columns in the left? Those are the actual statistics for the plan. We can compare them with the estimated values at the end to quickly detect any oddity in row estimation.
Note: SET STATISTICS PROFILE is also deprecated.
SET STATISTICS XML
This is the recommended, non-deprecated, way of requesting the actual query plan for each statement in a query. It works like SET STATISTICS PROFILE but, as the name suggests, it returns the plan in the form of an XML document.
Like all SET options, enabling it is quite easy:
SET STATISTICS XML ON
One advantage of both SET STATISTICS PROFILE and SET STATISTICS XML is that they return a query plan after each statement is executed, containing only the plan for that particular statement. This makes it quite easy to focus on the behaviour of a specific statement without having to scroll indefinitely inside the graphical viewer.
Graphical Show Plan
When we are working in SSMS, we can make use of a couple of shortcuts to request both the estimated and the actual plan for a currently open session. These will show up in the same graphical visualizer as we’ve seen before.
Estimated Plan
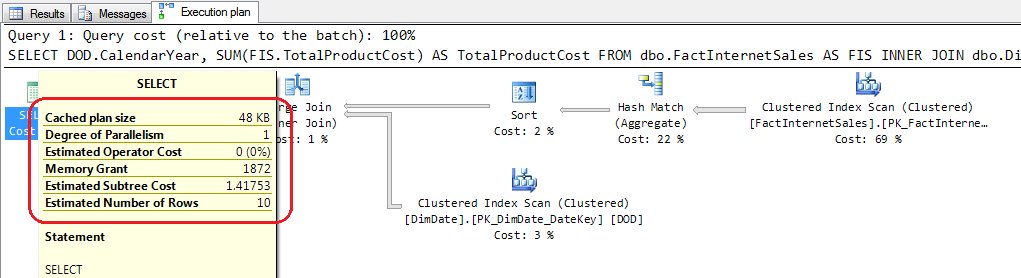
Requesting the estimated query plan in SSMS is as simple as clicking a button - literally. Just find and click the Display Estimated Execution Plan button:
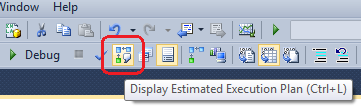
And voilà, yet again. The estimated query plan is quickly presented in the results pane.
Actual Plan
Requesting the actual query plan in SSMS is a bit more involved. It takes a whopping two clicks to achieve it. First, we need to enable the Include Action Execution Plan toggle-button:
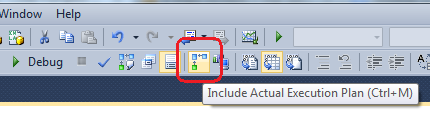
Then, we only need to execute the query:

And it’s a voila-hat-trick! The actual query plan is brought along with our results:
Phew, that was long! Can I go now? And What’s Next?
Yes, we’re done! Go get your hot chocolate, you’ve earned it! We’ve now seen the basic ways we can request query plans from SQL Server, some of which can be used from outside SSMS. On the next few pumpkins in this series, we’ll explore a couple of alternative ways of hunting query plan information, namely using SQL Trace and Extended Events.