
Taming Arbitrary Data in Power BI
Have you ever had to prepare a proof of concept for a BI system or report, having nothing more than a group of aesthetically pleasing user-created excel files
Then you will know how getting all that non-machine-friendly data into a database can consume so much time. Time you could use instead invest in preparing useful charts to show better insight into the business.
One of the very useful things about Power BI is how it lets you transform irregular data on-the-spot, without a need for prior complex treatment on another tool or system. This means you can take a jumble of assorted data and turn it into a usable model quick - an invaluable feature for the conceptualization phase, or even for the delivery phase, when you have no control over the format of your data feeds.
In this article you will see an example of how to do this in Power BI.
The Arbitrary Data
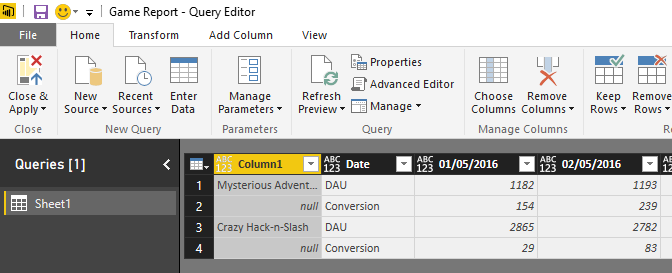
Consider the nice-looking worksheet below.
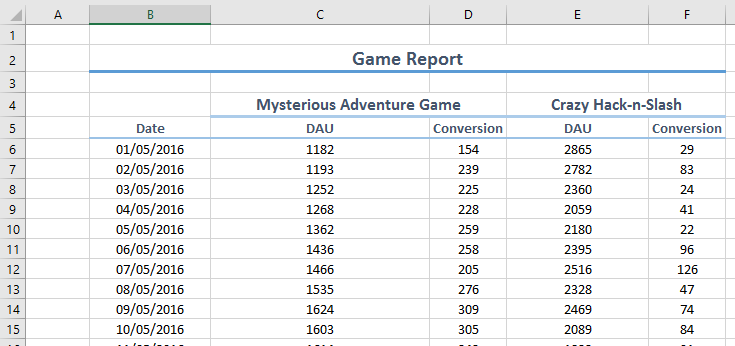
This example worksheet lists Daily Active Users and Daily Conversion numbers for two of your company’s mobile games. As you can see, the data in the worksheet looks good as far as human eyes go… Yet databases will have trouble making sense of all that pivoted data. With a classic ETL tool, you’d generally take one of these approaches…
- Manually unpivot this data straight in Excel.
- Load it as-is into the database, using some smart SQL to make sense of that data.
- Use your ETL to unpivot the data. (Let's not even go there. Just no.)
- Argue on how you need access to the source system data and hope to do things properly.
- Some other time-consuming approach.
The reality is, when you are doing a proof-of-concept, you want to make the best use of time. You want to fail fast, so you can find what works and discard what doesn’t, and present relevant options to the stakeholders while their value is maximal. Designing a robust system is important but you need to make a case for it in the first place. And you want to apply any valuable feedback as quick as possible too.
This is where the Query Editor in Power BI comes in. Its step-based engine lets you setup many transformations on the spot, some of which are very cumbersome to do in SSIS or other general ETL tools.
Let’s see how to use the Query Editor to turn this user file into usable data in a couple of minutes.
Taming That Data
As usual, you start by Getting Data in Power BI Desktop…
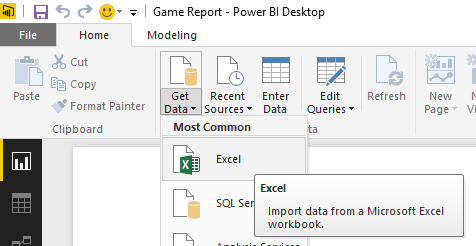
This particular example is an Excel file, but the general principles below will work with other data sources as well.
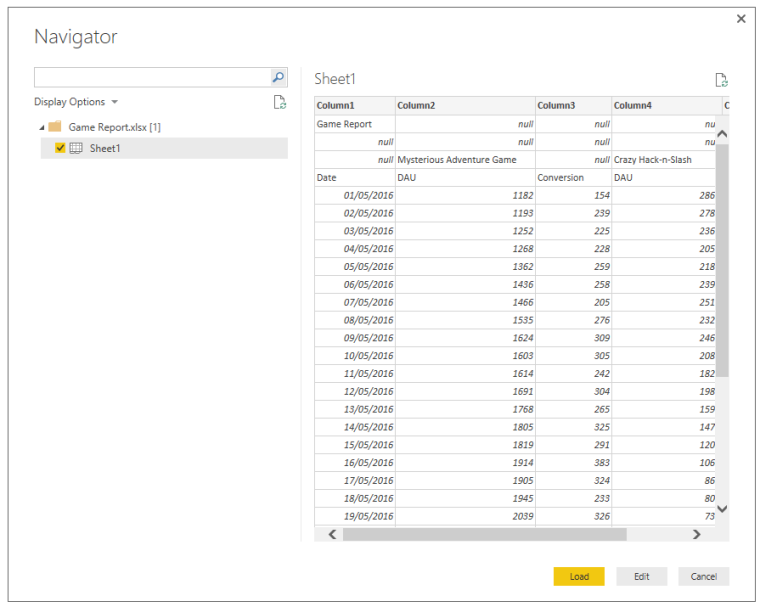
You can click Load to load the worksheet as-is and stay in the current window, or click Edit to do that and jump straight into the Query Editor window.
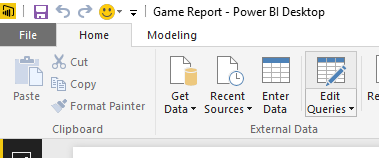
If you clicked Load, you can always go into the Query Editor window by clicking the Edit Queries button in any pane.
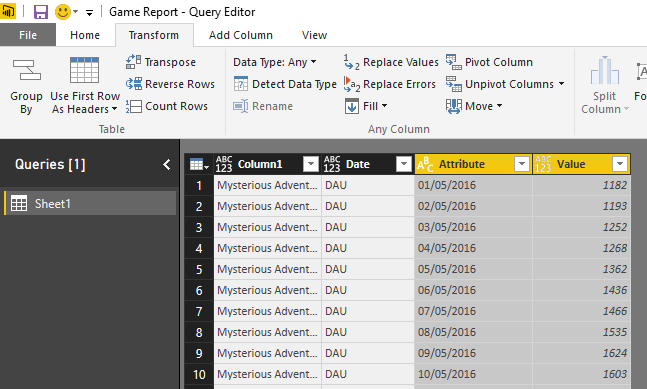
In the Query Editor window, you can see Power BI has loaded the worksheet pretty much as-is…
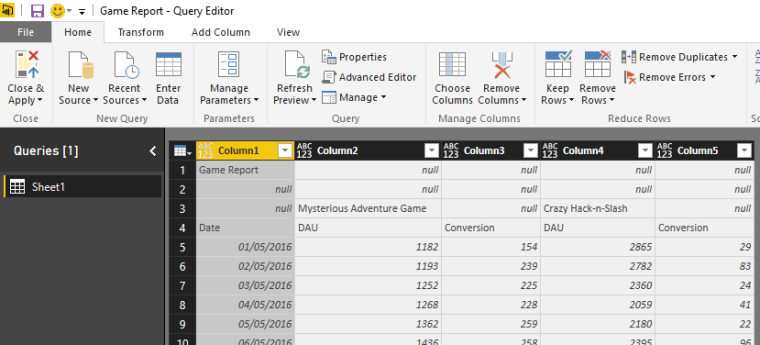
To make it usable to for analysis purposes within Power BI, we have to transform this into a columnar format as best possible.
So where to start? Well, you can start by discarding all the non-essential aesthetics-only rows, such as that Game Report title and the line below it.
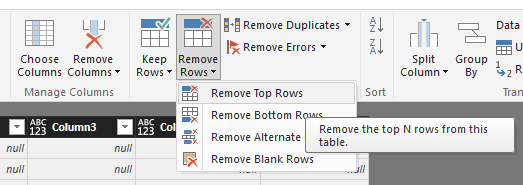
You can remove the top 2 rows by clicking on the Remove Rows Button in the Ribbon and then selecting the appropriate method.
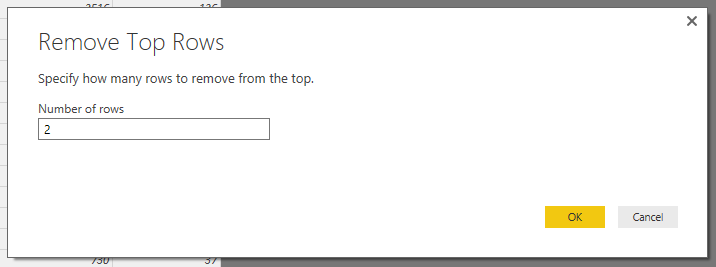
A window will pop up, asking you for the number of rows you want to remove - in this example 2.
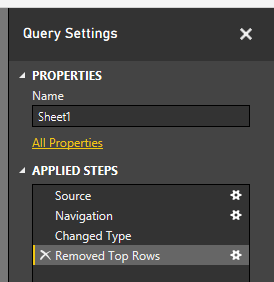
If you look at the Applied Steps in the Query Settings pane, you’ll see this step applied to the query.
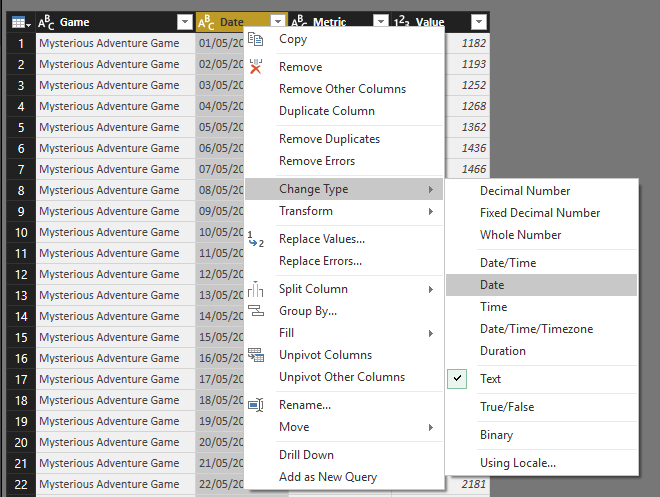
The next step here is to change the data type of that Date column to Text.
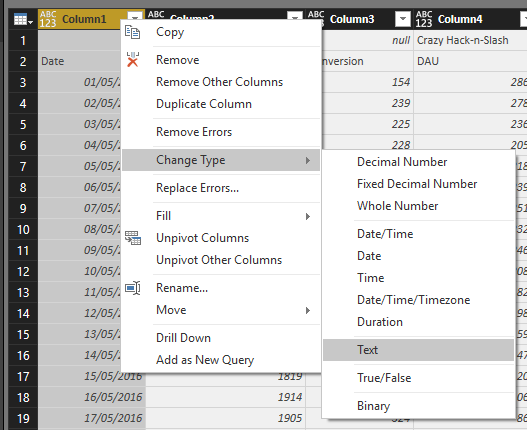
This isn’t immediately obvious, but keep going, and you’ll see why in a second.
Now comes the big bit! Let’s Transpose the entire dataset!
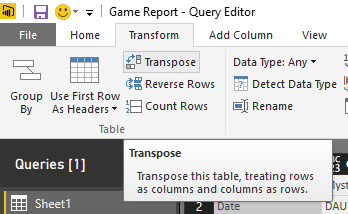
The idea here is to isolate the Game Names into their own column. You can now see that your game names, Mysterious Adventure Game and Crazy Hack-n-Slash are now happy in their columnar spot…
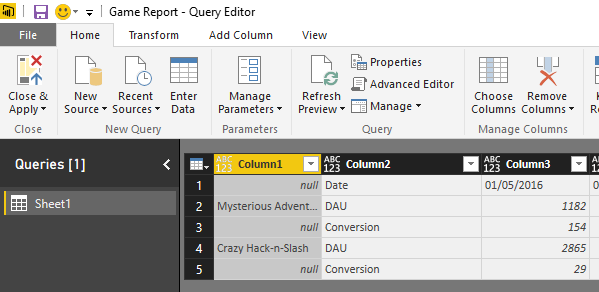
There are a couple of null cells between them, but before we fix that, we need to take that Date list out-of-the-way, while keeping the data consistent. We can do this by promoting that row of dates to table headers…
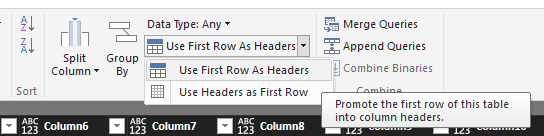
As you can see below, we still have some data pivoted (though in a different way than the worksheet) but at least we now have the Game column properly isolated.
Now the reason we changed the data type of the Date column to text earlier was for this step to work in the first place. As of this writing, Power BI will not promote date/time values to headers. If you had gone straight to this step without the earlier data type conversion, you would have kept seeing Column3, Column4, Column5, etc, as the column names. Changing the data type to text before hand allowed this step to work fine.
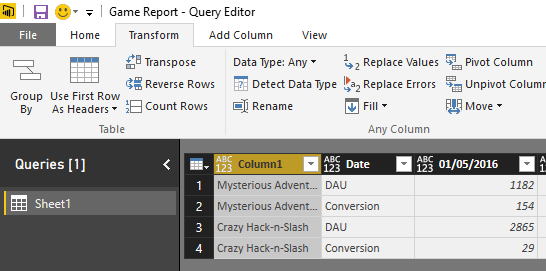
Let’s finish the job on this column by Filling Down values on it to clean up those null cell values.
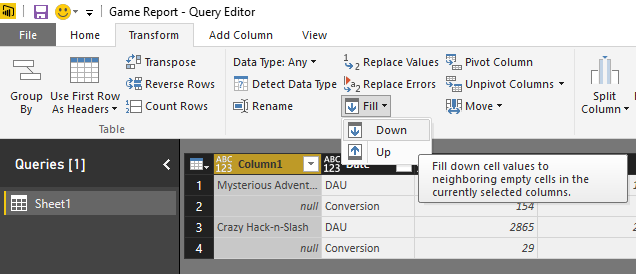
If you’re acquainted with Excel, Fill Down does exactly what you expected it to do…
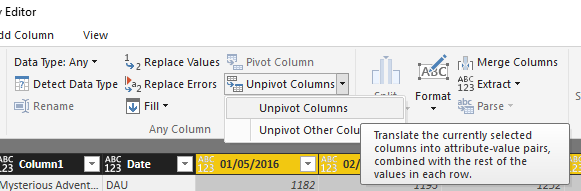
Now we take care of the rest of the dataset. All that’s left to do is to unpivot all those dates again, while pivoting the measures. This is almost the opposite of what we did when we transposed the dataset, except now we want to keep that Game column nice and tidy, while distributing the measure values over the rows. You can do this by selecting all the date columns and then clicking the Unpivot Columns button on the Ribbon…
And this is the result! Almost done!
You can finish by sprinkling some general neatness and adjust the column names and data types to something that makes more sense…
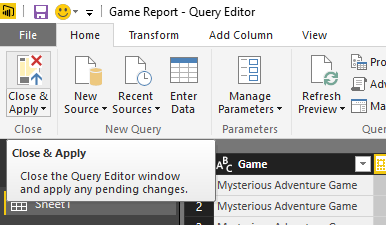
Once you’re happy, you can close and apply to get back to the main window…
And now you can finally play around with the data and draw up some charts from it!
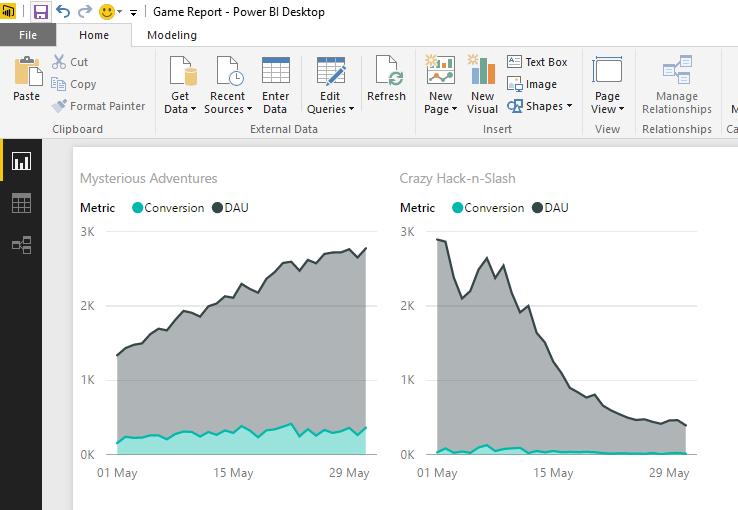
With a quick Power BI chart, you can see that while Crazy Hack-n-Slash is going bust fast, Mysterious Adventures is gaining good traction with players, and that the design has some room there to monetize the game better and increase conversion rates.
Wrapping Up
Preparing data for analysis and reporting over user-formatted content is usually a time-consuming process, regardless of the road you choose. Power BI’s Query Editor can help speed up the process a lot when your options are few. This doesn’t remove the need for proper analysis of the source systems and attentive data modelling. However, it does hasten the concept stage and gets you up and running to show the decision power of your data, pun intended.